Why a GPU Profiling Capture Turned into a Distributed Systems Problem
Starting from the ideas behind Meta’s MAIProf, I redesigned capture ownership, process discovery, and trace delivery for Kubernetes.
A training job has already been running for hours when throughput suddenly starts to fluctuate. At that point, the thing you usually want is not to stop the job, add a pile of profiler flags, and try to reproduce the issue. You want to take a snapshot of what is happening right now:
Start capturing for a few seconds, now, and bring back GPU traces from every rank.
On a single machine, this sounds like one profiler call. On Kubernetes, it quickly turns into a distributed systems problem: training processes are spread across nodes, a single Pod may contain multiple torchrun workers, sending a request does not mean Kineto actually accepted it, and a file appearing on disk does not mean it is complete—or that downstream analysis knows which rank it belongs to.
I did not start from scratch. The real starting point was Meta’s 2022 PyTorch Blog post: Performance Debugging of Production PyTorch Models at Meta.
Meta gave me the problem decomposition, not an implementation I could copy
That post describes the overall MAIProf idea: a user submits a profiling request; a Profiling Service discovers the GPU hosts running the training job and broadcasts the request to Monitoring Daemons on those hosts; Kineto generates one trace per GPU, uploads the traces to object storage, and the system analyzes them together afterward.
What mattered most to me was the problem decomposition rather than any individual component: profiling can be an independent service, and a capture should be treated as a job-wide operation rather than something attached to one process.
The public building blocks cover both ends of the pipeline. PyTorch torch.profiler and Kineto handle capture, dynolog provides the daemon-side path, and HTA analyzes traces. What is not public is the orchestration layer in the middle: how to discover a job, expand it into all profiling targets, track request lifecycle, and deliver a set of traces as one trustworthy capture.
More importantly, the public path carries a clear Slurm shape. Kineto uses SLURM_JOB_ID to identify the job, and upstream unitrace.py expands allocation hosts through squeue and scontrol. Kubernetes gives us something different: Pods that are rebuilt, multiple processes inside one container, selectors that can change over time, and a completely different controller failure model. The workload identity, process topology, and failure semantics are different, so the control plane cannot be translated one-for-one.
The per-job coordinator, ephemeral capture state, frozen target snapshots, at-least-once dispatch, and manifest-based delivery described below are therefore Kubernetes-specific trade-offs I made while following the same problem decomposition. They are not claims about Meta’s internal implementation. The profiling-operator described here is not currently open source either; this post is about the reasoning process, not a code release.
There is one more boundary that is easy to blur. MAIProf’s “No source-code change required” does not mean “attach to any arbitrary process after the fact.” My implementation also does not require changes to model source code, but the training workload must be armed at creation time with a hook, environment variables, and a shared directory so that Kineto enters daemon mode. You arm the workload once, then repeatedly trigger captures later without interrupting training.
In the first version, one capture was one CR
The first version followed the most natural Kubernetes Controller design. One capture was a ProfileRun. A central Operator watched it, discovered all target Pods, fanned out to the relevant nodes, and wrote per-rank progress back to status.
The benefits were real. Users could watch progress with familiar kubectl get -w. If the Operator lost leadership, a new leader could recover from state already stored in the API Server. Kubernetes had already solved persistence, watch delivery, concurrent updates, and access control for me. At first, there seemed to be no reason to build something else.
The problem appeared while I was reading through the Reconcile path. The controller had a single worker by default, and fan-out was synchronous. If one node silently dropped packets, one Reconcile could occupy the only worker for a long time. The next item in the queue might not be another rank from the same job. It could be a completely unrelated training job elsewhere in the cluster. A node-local data-plane failure could therefore become a cross-job control-plane stall.
This was not an incident that forced the redesign. It was a risk visible directly from the code path, and I did not want to wait for it to block unrelated workloads in production.
The cheapest fix was obvious: increase MaxConcurrentReconciles, add timeouts to fan-out, and move node calls into goroutines. That would reduce head-of-line blocking, but it would not change the actual boundary of the problem. As long as I wanted a capture to continue across leader failover, I still had to persist the target snapshot, timing origin, deadlines, and per-target state. Every rank transition would still become an API Server write. None of the temporal protocol disappeared.
More workers would only allow more captures to occupy central control-plane resources at the same time. They would not isolate a failure to one job.
That is why I did not stop at “optimize Reconcile.” One capture naturally belongs to one attempt of one training job. Target membership, permissions, archive prefixes, and lifecycle are all job-scoped. The real mistake was not a concurrency setting. It was where orchestration lived.
Then I gave capture back to the job
In the second version, the central Operator only owns the slow path. It discovers training jobs that have profiling capability and creates one coordinator for each (job, attempt). Capture requests go directly to that coordinator. The coordinator expands targets in memory, fans out to node agents, waits for traces, and decides when the capture converges.
The node agent still owns only the things that are inherently local: PIDs, UNIX sockets, dynolog, and files.
                         create / garbage collect
Lifecycle Operator  ------------------------------>  Per-job Coordinator
                                                        ^          |
                                                        |          | fan-out / query
                                             Start /    |          v
                                             Watch      |      Node Agents
                                                        |          |
CLI / Gateway  -----------------------------------------+          v
                                                               stock dynolog
                                                                    |
                                                                    v
                                                              Kineto workers
                                                                    |
                                                                    v
                                                            Node-local traces
                                                                    |
                                                        verify / archive
                                                                    |
                                                                    v
                                                             Shared storage
                                                                    |
Per-job Coordinator  -------- manifests ----------------------------+--> HTA analysis
The benefit of this split was clear. The capture hot path no longer writes to the API Server. One stuck node affects one job instead of the entire cluster. Restarting or re-electing the central Operator does not interrupt captures already driven by a coordinator.
The bill was equally clear, and it was not cheap.
The first version’s native kubectl get -w became a read API on the coordinator. The failover recovery I got for free from CR persistence was not carried over either. If the central Operator changes leaders, nothing happens to an in-flight capture. But if the coordinator itself dies, an unfinished capture is abandoned. A replacement coordinator can only answer Unknown for that old capture.
Every armed job also keeps a coordinator Pod alive, which consumes resources and tenant quota. If a request arrives before the Pod is Ready or before its endpoint exists, there is a cold-start window. The external interface becomes two layers rather than one: a CaptureCoordinator CRD for lifecycle and a gRPC API for individual captures.
The redesign also changed how I think about the Kubernetes API boundary. The API Server is a good place for desired state and slow lifecycle state, but that does not mean every short-lived distributed protocol should be encoded into CR status. The issue is not simply that “the API Server is slow.” The capture hot path, its state ownership, and its failure domain all belong to the job. Persisting them into a global control plane buys cross-failure recovery and cross-job coupling at the same time.
The second version did not remove state from the system. It changed who owns that state and where it is persisted. I gave up some of the first version’s durability—kubectl get -w and resuming after control-plane failover—and paid for resident resources plus a more complex API surface. In return, I got isolation and hot-path independence.
To make sure a capture always terminates, the coordinator freezes the target snapshot at the end of prepare. Pods that match the selector afterward—whether from scale-out, rebuild, or retry—belong to the next capture. Otherwise the target set could keep changing while the capture is running, and the capture might never finish.
I also explicitly gave up several tempting features. Each target starts as soon as it can; there is no broadcast startTime and no barrier, so cross-rank alignment is left to analysis. Dispatch is at-least-once, keyed by captureInstanceID + targetID; a duplicate trace is acceptable, while a missed trace is the real loss. Capture windows are wall-clock only because iteration windows require the training loop to cooperate through profiler.step(). Cancellation is logical only, because stock dynolog cannot retract a configuration that has already been dispatched.
These are not restatements of Meta’s design. They are the boundaries I chose for this Kubernetes implementation.
After the redesign, the cluster started changing the answer
If I tell the story only in the order above, it is easy to make it sound like one clean redesign solved the architecture. The actual timeline was less tidy.
The first version’s global blocking risk came from code inspection. After the second version took shape, a different set of problems started appearing in real end-to-end runs. The single-Pod, multi-process under-capture risk was confirmed by acceptance testing. The distinction between matched and triggered came from upstream source reading, and the matched-but-busy branch later showed up in the cluster. The announce/verify split came from a real data-loss incident and took three rounds to fix.
So the rest of the story is not “the architecture anticipated everything.” It is a structural redesign followed by a sequence of runtime evidence that kept correcting the implementation.
One Pod is not one profiler
The most natural Kubernetes target is a Pod, but the profiler actually talks to processes. In a single-process container those happen to line up, which makes “one target per Pod” look completely correct.
Now replace that workload with a common torchrun --nproc-per-node=8 setup. One container has eight workers. The old logic can still report a beautiful SUCCEEDED 1/1 while capturing only one eighth of the job. The dangerous part is not that it fails. It is that it succeeds so quietly.
The fix cannot be “have the agent scan /proc and guess.” PID 1 is often just the launcher, the agent may live in a different PID namespace, and it cannot reliably answer which child process corresponds to which global rank.
The final design lets the coordinator expand a Pod into multiple logical targets using the local world size and base global rank recorded at creation time. Each worker then registers its own rank, PID, and job attempt through a very thin hook before import torch.
This is where “arm at creation time, trigger at runtime” actually carries the architecture. If you wait until runtime to infer process identity, it is already too late.
Matched does not mean the shutter has fired
The node agent ultimately asks stock dynolog for an on-demand trace. Its response exposes two fields that are easy to collapse into one meaning: processesMatched says dynolog found the target process, while activityProfilersTriggered says the configuration actually entered the profiler’s pending slot.
If the profiler is busy, the process can be matched without being triggered. Treating “matched” as success tells the user that capture started, and then no file ever arrives.
The state machine therefore has to distinguish “queued,” “waiting for an available slot,” and “not matched yet.” Even then, the strongest statement it can make is “queued by dynolog.” It cannot claim that Kineto consumed the configuration.
That is also why I kept stock dynolog instead of forking it to obtain a prettier state model. The cost is an observability ceiling: I cannot see exactly when Kineto consumes a configuration, I cannot see poll liveness directly, and I do not have a physical cancel. The benefit is that I do not own a private protocol tied to upstream memory layout and version details. I would rather stop the state machine at the strongest fact I can actually observe than invent a stronger “received” state.
A test that would always pass
This path also produced a subtler false success. Kineto’s activity-type key is singular: ACTIVITY_TYPES, not the more natural-looking ACTIVITIES_TYPES. With the wrong spelling, upstream does not fail the capture. It ignores the field and falls back to a default set.
That default set happened to be a superset of what the request asked for. As a result, the test “all requested activity types are present” passed whether the mechanism worked or not.
What finally caught the bug was a negative assertion: verify that an explicitly excluded python_function activity was not present.
That became a simple rule I now use when judging tests:
If a test sees the same result whether the mechanism exists or not, it is not a test yet.
There is no “capture complete” acknowledgement, so I had to watch the file
dynolog/Kineto can accept an on-demand configuration, but it does not provide a reliable completion event suitable for a control plane. When a trace finishes, the durable fact is that a temporary file gets renamed to its final name. The protocol does not tell the coordinator, “capture completed.”
The node agent therefore has to observe that final filesystem fact.
The first implementation discovered and validated files sequentially in one scan. The problem is that validating a large trace is O(bytes). If reading one trace takes close to a hundred seconds, files that landed afterward may not even get globbed before the scan finishes.
The real failure happened with two concurrent captures. Both sets of trace files were complete on disk, but one capture still converged to MissingTrace.
The first fix anchored the deadline to the point when trace activation was actually observed. The second added a hold that delayed the terminal state while a file was being verified. Both were logically reasonable. Both still failed under cluster retest.
The reason was deeper: both protections required an observation from the agent before they could activate, while the observation itself was being starved by validation of the previous large file.
The third fix finally touched the root cause. The agent first performs a fast announce of every file seen in the current scan, then verifies asynchronously. Even the first announce/verify split was not enough because both steps still shared one non-reentrant ticker goroutine. Only after Announce and Verify moved onto independent cadences did O(bytes) validation stop blocking the appearance of new evidence.
The lesson from that incident was not “validation is slow, so use goroutines.”
It was:
Extending how long the control plane is willing to wait cannot fix how slowly the data plane is able to observe.
A hold triggered by observation can never be more reliable than the latency of that observation itself.
A verified file still cannot immediately be declared successful. Local disk on a training node is a good place for Kineto to land bytes, but it is not a durable delivery address. The agent has to enforce this order:
verify → archive → publish manifest
That sequence copies the trace one extra time, briefly consumes two copies of the bytes, and delays the final result by the archive step. But if the system declares success before the copy, status can already say Archived while the only bytes are still trapped on a node that may be reclaimed.
The extra I/O buys a completion semantic the system can actually keep.
The coordinator also pulls completion status from agents rather than having every agent push events. Push has lower latency, but it requires reverse-serving paths, identity, and network policy. More importantly, a transiently unavailable coordinator can permanently miss an edge-triggered event. Pull adds polling traffic and a few seconds of convergence delay, but manifests are level-triggered facts. Missing one poll does not make an already-existing manifest disappear.
A trace eventually needs a receipt
Once traces reach shared storage, the easiest analysis path is to scan a directory and read every JSON file in it. But a directory can only tell you “these files exist.” It cannot prove that they belong to this capture, that all expected ranks are present, or that an old trace from a previous attempt was not picked up by mistake.
The manifest is the receipt connecting logical rank identity to physical bytes.
It records the target, rank, attempt, archive URI, size, and checksum. The analysis Job reads only files referenced by the manifest and verifies the checksum again before consumption. A file that exists but is not referenced by the manifest is intentionally ignored.
The cost is that the manifest becomes a contract between capture and analysis that must be maintained. Orphan traces are deliberately excluded. But that explicit coupling is still better than having every downstream consumer scan directories and independently guess rank mapping.
The analysis path also rejects an empty manifest. A program exiting with status 0 proves only that it did not crash. It does not prove that it analyzed any data.
At this point, the invariant that runs through the entire system can finally be stated directly:
request dispatched
≠ profiler triggered
≠ trace file appeared
≠ trace validated
≠ trace delivered

capture converged =
  every frozen target has either
  (a) a verified, archived, identity-bound artifact in the manifest
  or
  (b) an explicit terminal failure

capture fully succeeded =
  every frozen target took branch (a)
An explicit terminal failure means the capture converged. It does not mean the capture fully succeeded. The system can only say “we got the whole shot” when every logical target in the frozen snapshot maps to a verified, archived, identity-bound artifact in the manifest.
The final toy job was a smoke test, not a benchmark
I finished by running the full pipeline on a deliberately small DDP job: two machines, two workers per training container, four ranks running a real collective. Four traces went through local observation, validation, and archival, and then an HTA Job consumed them through the manifest.
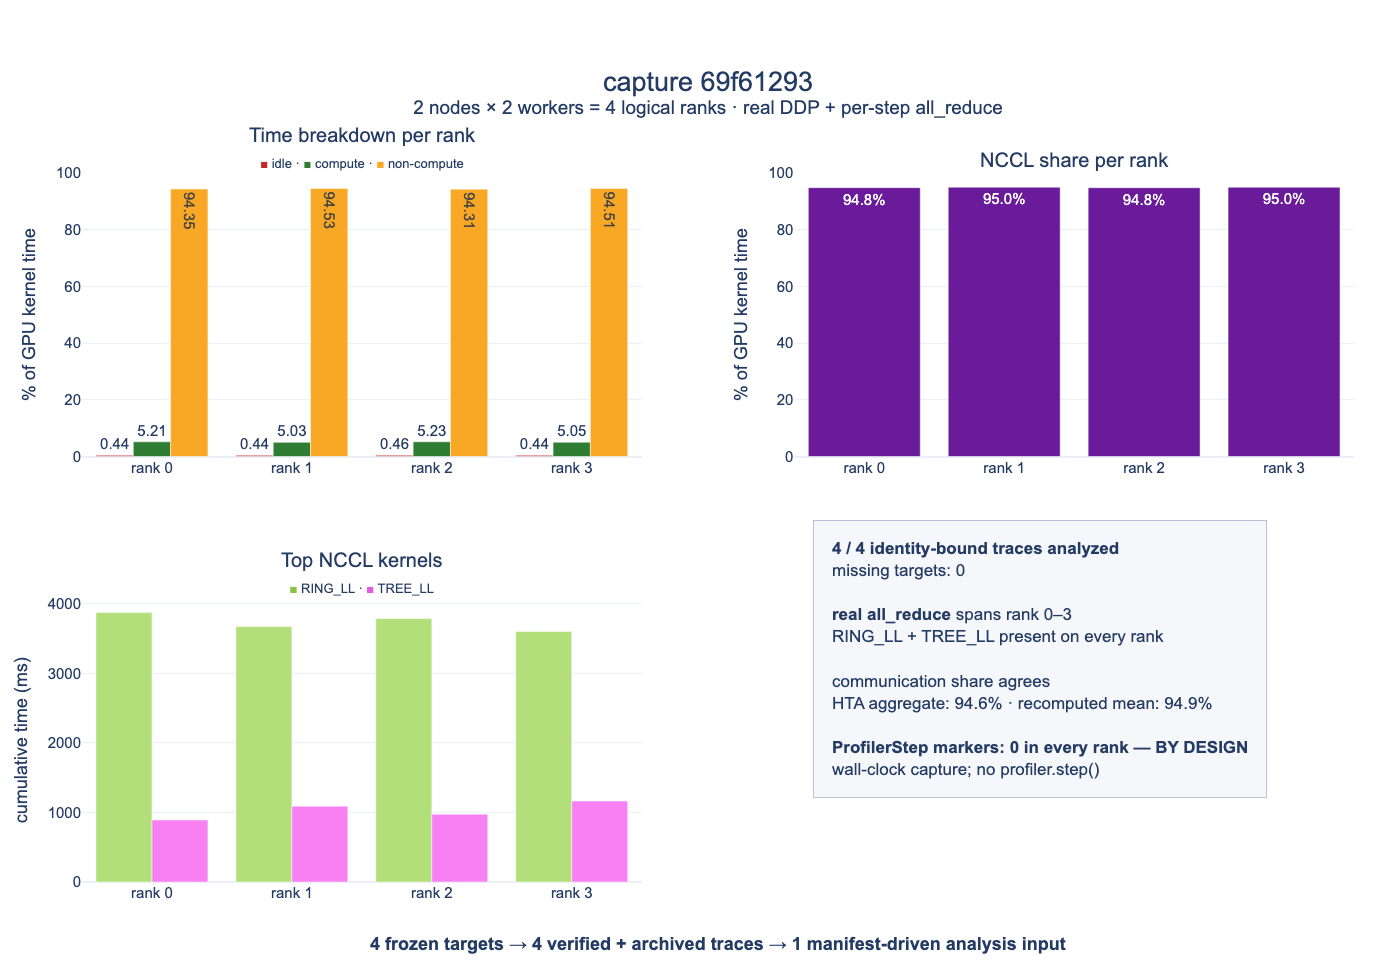
The performance ratios in this figure are not useful for workload diagnosis. The job is an intentionally synthetic communication bottleneck with very little compute. The NCCL kernel shape and roughly 1.5 GB/s effective bandwidth are much closer to Pod-network TCP behavior than NVLink.
It does not represent a real model, and it should not be used to judge whether a production training job is healthy.
The footer’s ProfilerStep markers: 0 in every rank -- BY DESIGN is also not a defect. This system provides wall-clock windows only. Iteration-scoped capture would require the training loop to call profiler.step(), which is explicitly outside this phase.
What the toy job proves is only the pipeline:
- multiple workers inside one Pod were not collapsed into one profiler target;
- ranks across nodes received the same logical capture;
- every trace was verified and archived;
- the analysis Job consumed one identity-bound, checksummed set of files through the manifest.
It is a smoke test, not a benchmark.
Closing
What I took from MAIProf was the idea that profiling should be treated as a cross-host system, not a hidden copy of an unpublished internal implementation.
The public pieces solve capture, daemon communication, and analysis. They do not answer the harder Kubernetes questions for you: who discovers the real training processes, who owns one capture, whether state survives failure, when a changing Pod set becomes fixed, and what evidence is strong enough to say a trace has actually been delivered.
The first version put those answers into one central Operator. The second version gave capture ownership back to the job, then let the node agent guard node-local facts and the manifest guard delivery facts.
It is not a line-by-line port of MAIProf. It is a different set of choices made against the same underlying problem on a different infrastructure substrate.
The hard part of on-demand profiling is not pressing the shutter. It is making every photo taken across different nodes prove that it belongs to the same shot.